
Definitions
There are many recent news articles that discuss post-pandemic office reopening plans:- https://www.bloomberg.com/news/articles/2021-06-14/wall-street-s-return-to-office-divide-laid-bare-by-goldman-citi
- https://www.cnn.com/2021/05/05/tech/google-office-remote-work-pandemic/index.html
- https://www.cnn.com/2021/04/14/tech/uber-office-return-employees/index.html
One topic that seems to be missing in the current reopening discourse is how reopening an office should depend on the type of work that is done at the office. Here are four very very broad categories of work that can happen at offices:
1. Internal-infrastructure work
2. Internal-creation work
3. Internal-collaboration work
4. External-collaboration work
The decision to reopen should be based on the extent to which each of these types of work is necessary to a particular firm. Some types of work are impacted heavily by being able to do in-person work, others are not. Let’s define each type:
Internal-infrastructure work is dominated by tasks that require the worker to touch property owned or controlled by the firm. Examples include operation of factory equipment, maintenance of on-premise IT infrastructure, testing and design of physical products, and janitorial work. This work cannot be done remotely. Note that external infrastructure work is somewhat irrelevant to the question to reopen an office. Work that requires employees to view/edit highly confidential or sensitive information can also be added to this category, as the physical security of the location where the viewing/editing is happening is largely an infrastructure question.
Internal-creation work is knowledge work that is done in isolation by employees. Examples of this include creating/modifying documents, creating/modifying spreadsheets, writing computer software, and creating/modifying presentations.
Internal-collaboration work is dominated by tasks that require communication among members of the firm. Examples of this type of work include synchronous and asynchronous communication tasks — meetings, emails, electronic chats, informal hallway chats, one-on-one meetings, etc.
External-collaboration work is typically done in a sales or customer support capacity. The work is dominated by a need to communicate with external parties to the firm in a way that pleases. Pleasing non-customers results in sales, pleasing existing customers reduces customer churn. This category can also be applied to non-sales-but-external functions such as recruiting, where, for example, prospective employees can be viewed as a type of customer.
This post will focus on quantifying the impact of reopening an office on external-collaboration work.
Quantitative Analysis
Do business trips increase sales? Do customer meetings at a Very Nice Office result in better win rates? The answer is “it depends.” More specifically, “it depends on the percentage of your customers that are willing to interface in-person.”
Intuitively it may seem obvious, but it is a question that can be modeled and answered quantitatively. Specifically, win-rate investments in things such as business trips and in-person events (which also require in-person reciprocity from the customer) will have their overall impact bound by the overall extent to which those customers have returned to in-person operations.
Mathematically, we can define our sales velocity for a given strategy (remote, in-person) SVstrategy to be equal to the product of the probability of a given sales rep from the team winning a sale, based on their skills alone, the volume or size of the sales team using that strategy, and the probability that the strategy “matches” a given prospect from the marketplace:
SVstrategy = P(winstrategy) · volstrategy · P(matchstrategy)
Note that there is an implicit time value of unity in this rate expression. The notion of a “match” here is intended to reflect that in-person sales only work when both the customer and the sales rep meet in-person.
If we make the (strong) assumption that the market bifurcates into two non-overlapping sets — customers that only take meetings remotely and customers that only take meetings in-person, we can say that in-person sales teams will take market share when:
SVin-person > SVremote
I.e. when:
P(winin-person) · volin-person · P(matchin-person) > P(winremote) · volremote · P(matchremote)
If we then note that in-person “outside” sales teams are typically more expensive to run than remote “inside” sales teams, with in-person teams making up in additional win-rate with what they lack in size, we can then assume, roughly:
P(winin-person) · volin-person ≈ P(winremote) · volremote
An example of this assumption: a 20-member inside sales team with a win-rate of 10% can roughly be compared with a 10-member outside sales team with a win-rate of 20%. So if we assume all of that, we are left with an in-person-sales strategy taking market share from remote sales when:
P(matchin-person) > P(matchremote)
Oversimplified: remote sales strategies will continue to take market share as long as the market is predominantly operating remotely.
The above analysis assumes a lot. For example, it doesn’t consider the possibility that a sales team could have the option to handle a sale either remotely or in-person. Nor does it consider the very-real-world notion of a shootout, where sales teams compete in the same marketplace. And I am too lazy to write down conditional probability expressions tonight.
Simulation
To model these scenarios (and the probability of a in-person sale conditioned on the probability that the prospective customer operates in-person), we proceed with a simulation. Suppose you are the head of sales at a small firm that competes within a larger universe of firms. You have 20 sales people on your team. Your competitors, in sum, total 100 sales people. Your market consists of 1000 customers that are not quite operating at pre-pandemic levels, in terms of willingness to do deals in-person. Say they are operating 40% in-person. Customers that are open to in-person deals can also do sales deals remotely.
You, the head of sales, have two levers at your disposal — you can invest in in-person trips and events to really focus on those 40% of customers that are receptive to in-person interactions, thereby increasing your win rate with those customers, or you can invest in growing the effective size of your sales team (by hiring more, investing in online chat or video-conferencing tools that expand their reach, etc. etc.).
Assuming that the baseline remote-only win rate is 10%, we can run a monte carlo simulation that compares the results of increasing the 20-person team’s win rate for in-person deals progressively, with a strategy that increases the size of the 20-person team (either by hiring or investing in remote work technology adoption). A monte carlo simulation is an alternative approach to solving for the end-result of a probabilistic process when it is too complicated to model all aspects of the process. Here we are using it because we are too lazy to write down and solve equations that model a sales team that can handle in-person or remote sales in a competitive environment.
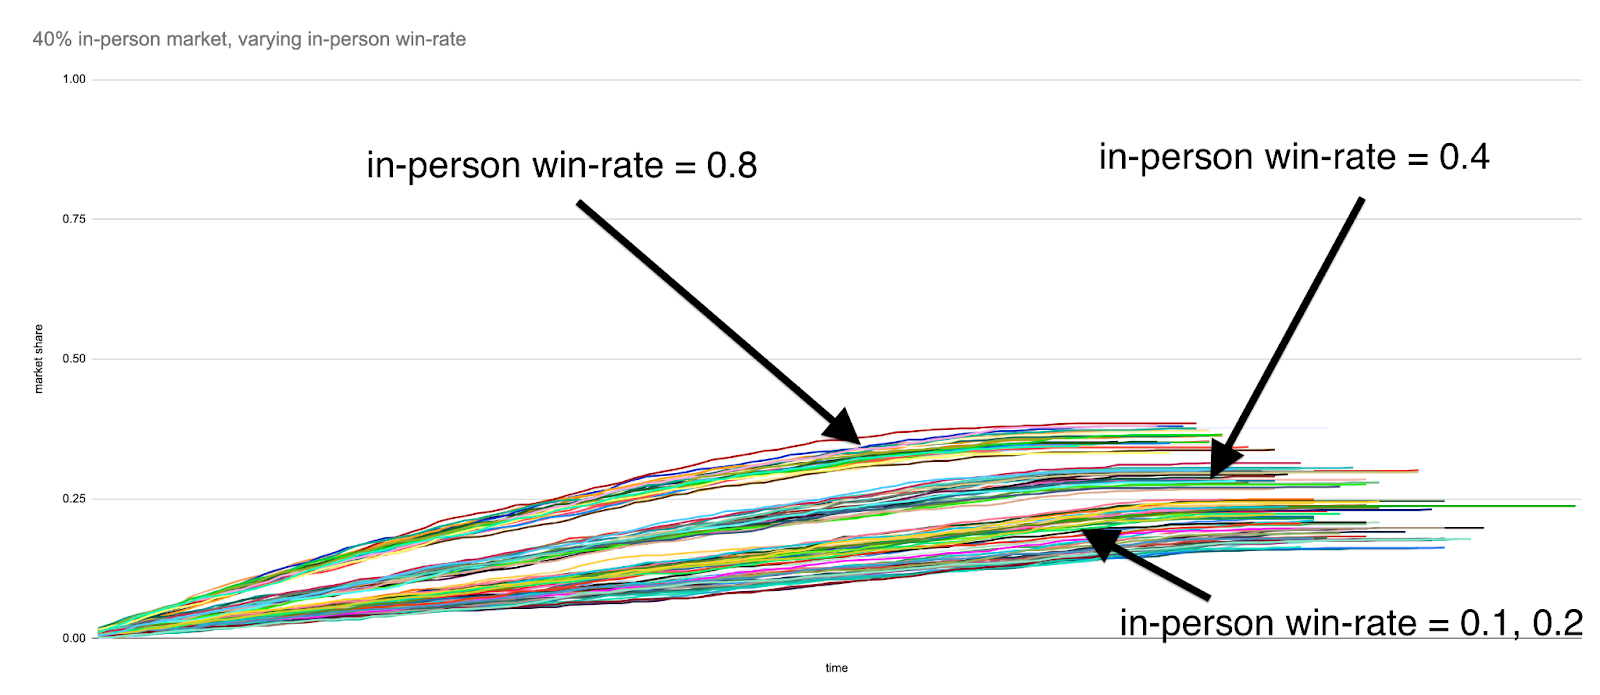
We first assume that the percentage of the customer base that is receptive to in-person sales stays constant at 40%.
ON EVERY CHART THAT FOLLOWS, THE Y-AXIS REPRESENTS MARKET SHARE, RANGING FROM 0.0 TO 1.0 AND THE X-AXIS IS TIME.
Here are the results when we examine in-person win-rates of 0.1, 0.2, 0.4 and 0.8:
And here are the results when we successively double the team size — 20, 40, 80, 160:
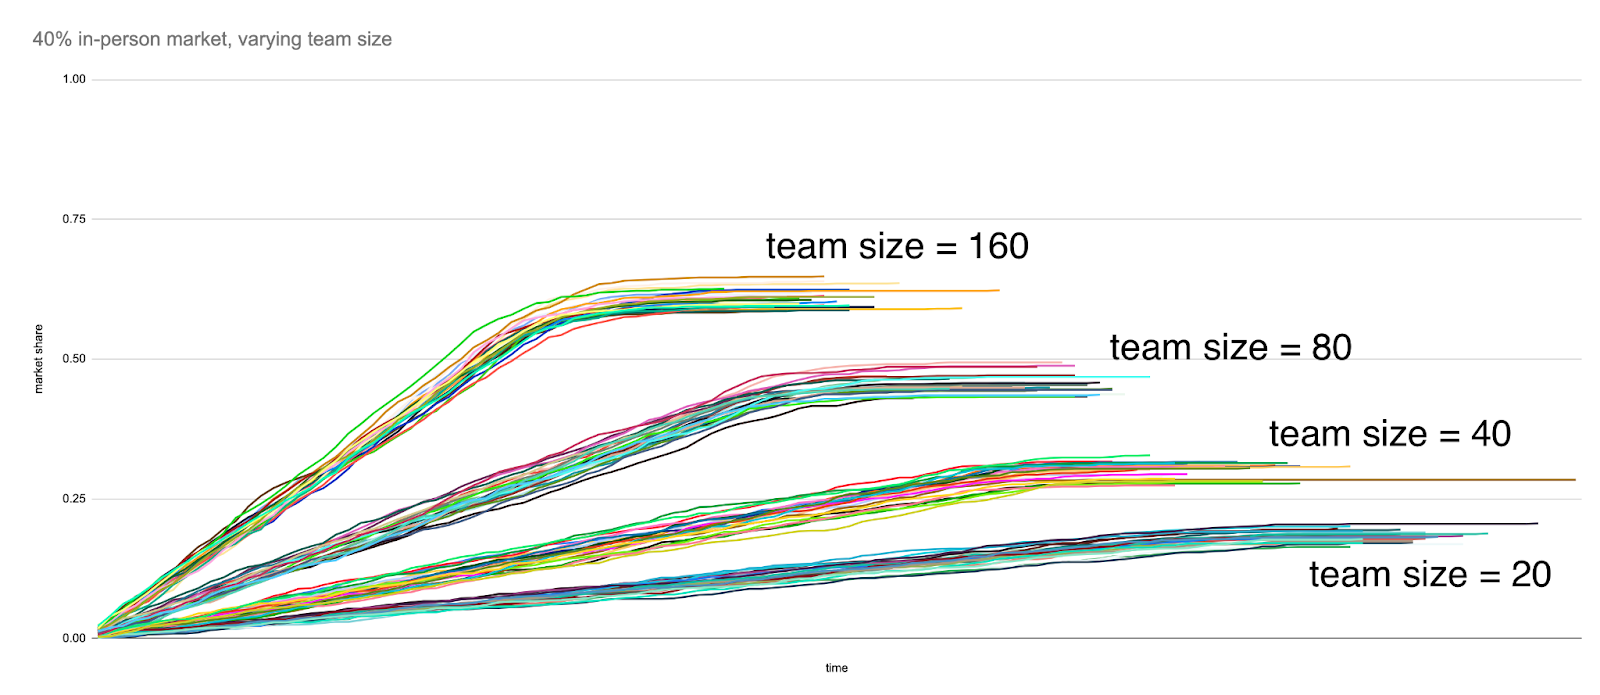
And again, the x-axis of each chart is a representation of time within each simulation, where a “tick” of the clock corresponds to each sales team replacing their current set of leads with new leads from the prospective customer base at random. The y-axis represents the in-person team’s market share at a given point in the simulation. When a line flattens out, that is an indication that a particular execution of a strategy (e.g. choosing to invest in in-person sales events to raise the in-person win rate from 0.1 to 0.2) has completed, and the eventual finishing y-value of that line corresponds, roughly, to a notion of “eventual market share”. The lines are grouped into clusters of 25 runs for a given in-person win rate.
While this analysis doesn’t take into account any notion of cost of revenue, you can see that there is a very direct relationship between the team size and eventual market share, that is eventually bound by the team size relative to the competition — if you keep growing the size of your sales team, either by hiring or making them more efficient, you will continue to capture market share. As expected, things are a little bit less straightforward with increasing the win rate for in-person deals only. While eventual market share increases steadily as in-person win-rate is increased from 0.1 to 0.2 to 0.4 for in-person sales, a sales team with an in-person win rate of 0.8 is still bound by the share of the market that is operating in person.
Here is the same simulation run for prospective customer base proportions equal to 60% and 90%, respectively:
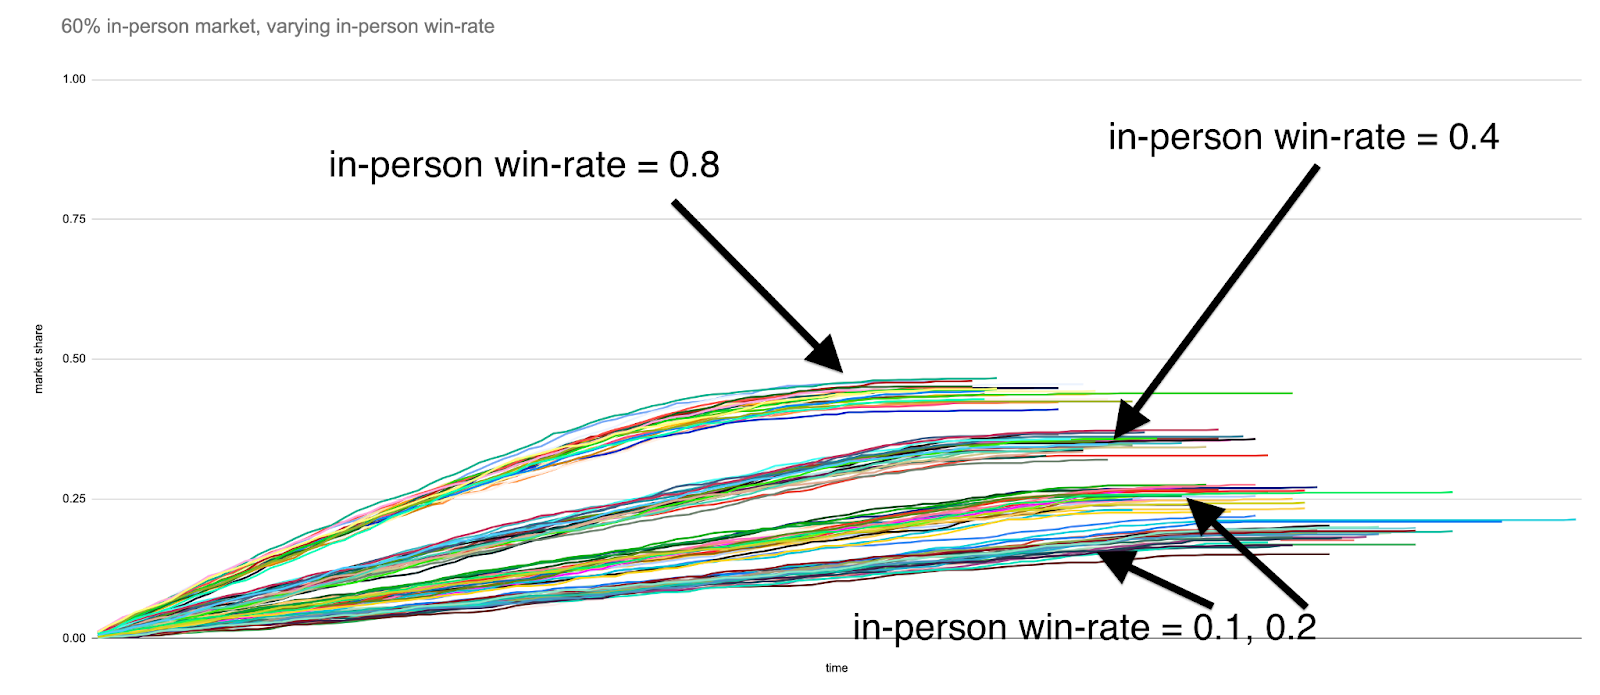
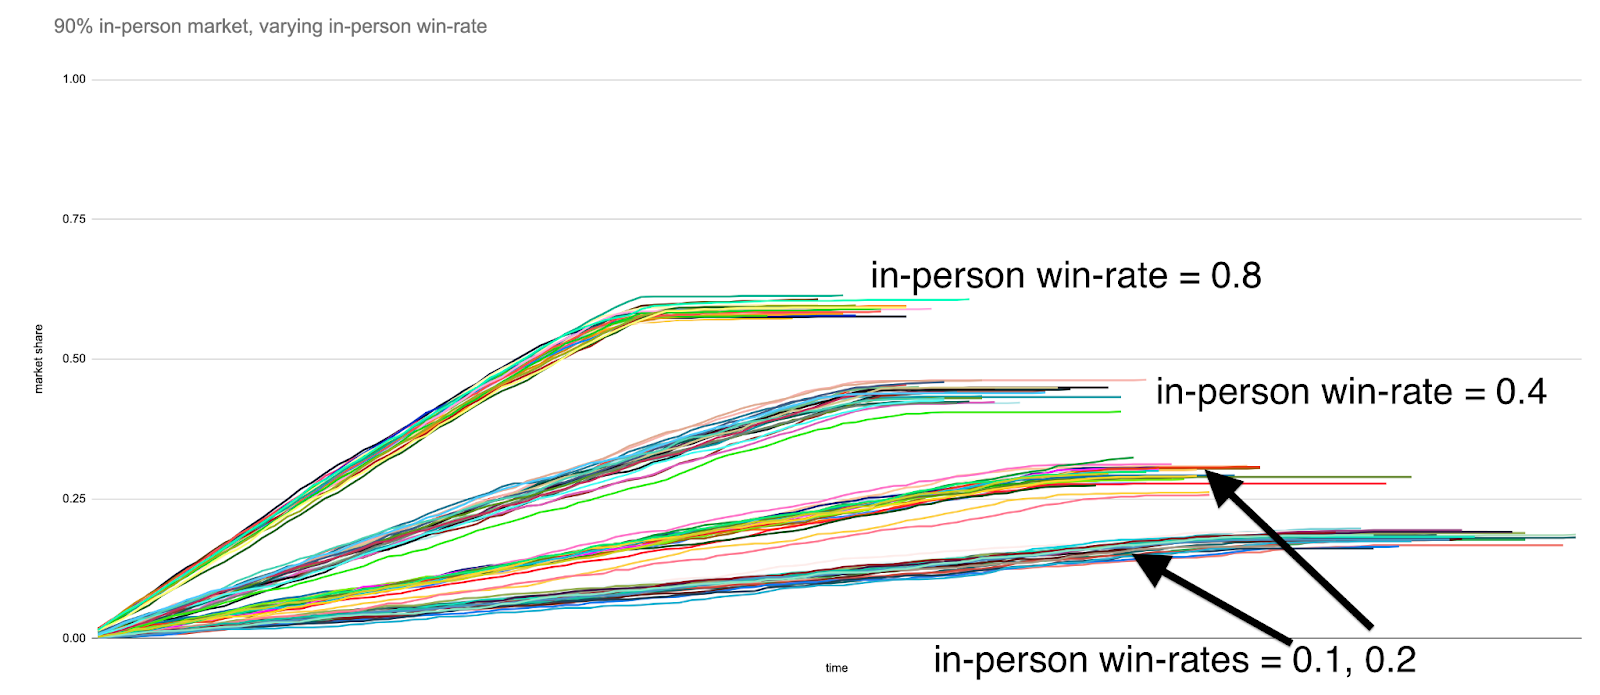
We see that investing in in-person strategies to boost win rate only start to perform as well as growing the sales team size once the market has approached pre-pandemic levels of in-person operation.
Conclusion
For firms that have a heavy external, customer-facing component to their operations, the decision to return to the office depends on an estimate of how quickly the world is going to transition back to in-person work. If you think that business travel is going to snap right back, then it perhaps makes sense to also invest in in-person events for your own sales team.
If, however, you are looking at the recent news about, for example, the delta variant, and think “hmm maybe we won’t be going back to huge 10,000 person sales conferences right away”, perhaps it makes more sense to invest in scaling out your sales team, either by hiring more, or investing in remote-work technology, or both.
If you are curious, here is the code used to run the above simulations.